Day Quantifier
THE CHALLENGE
-
This is a pure personal project to make a style of todo list that suits me
-
Current to do's are not quantifying my day relative to certain important and relevant tasks that I want to accomplish
-
Current to do's that I'm using are not tracking things over time too
THE OUTCOME
-
Personal analytics dashboard that quantifies my day based on certain weightage
-
Tracking things over time to give me a long term picture and the scope for improvement
MY ROLE
-
This product is just for me, so I was solely responsible for all design and development
01
THE BEGININGS
"Definition of a good To do List is different for different people. For some its just a checklist and for others its much more and central to their entire worklife "

I want to build a small feature to learn React and started looking at my own life about somethings that I could exclusively use for myself. And then I found out I have few issues and unmet needs related to the productivity tools that I'm currently using.
ISSUES WITH TRADITIONAL TODO APPLICATIONS FOR ME
-
Every item in the todo list has equal importance. Finishing small and redundant things might give me a feeling that I have accomplished a lot, even though technically it isn't the case
-
Tracking things over time. I want to track my progress across health, career related categories separately but very few of them have option to track todo's across time
-
Feeling of how productive the day is visual currently and I wanted to associate a specific number to gamify it
02
SOLUTION
“Day Quantifier” is a personal analytics dashboard project. It quantifies your day by giving weighted scores to help you focus on the things that matter. There are 4 different variations of todos with explanations of what they are. The division is based on the initial study that I conducted with students on their perception of productivity. The division is intended to solve their problem concentrating on things that matter. Oftentimes students think they are productive but end up doing something unnecessary for their immediate goals. So in the day quantifier they can add the tasks that they have in different sections and calculate the score for their day based on the importance of each bucket which they give through weightages. This way they have a perfect reflection of how their day went with respect to their immediate goals and expectations from them.
In this final project, I primarily focused on the backend part of the application. One major challenge is to sync across sessions and todo so I used firebase as the backend tool. I fetch the and display the data through real time APIs. Every minor addition by the user gets added to the server in real time, so that whenever he/she signs out, he could sign in back to the dashboard with where he/she left off.
I added the time left for the day to help users give a gamified sense of mission. And whenever they finish a task the score in that particular division updates with delightful progressbar animation so that in the future when we work on corresponding insights on how each of the sections went, they could view them. It also gamifies each block. This day quantifier will help students quantify their day productivity.
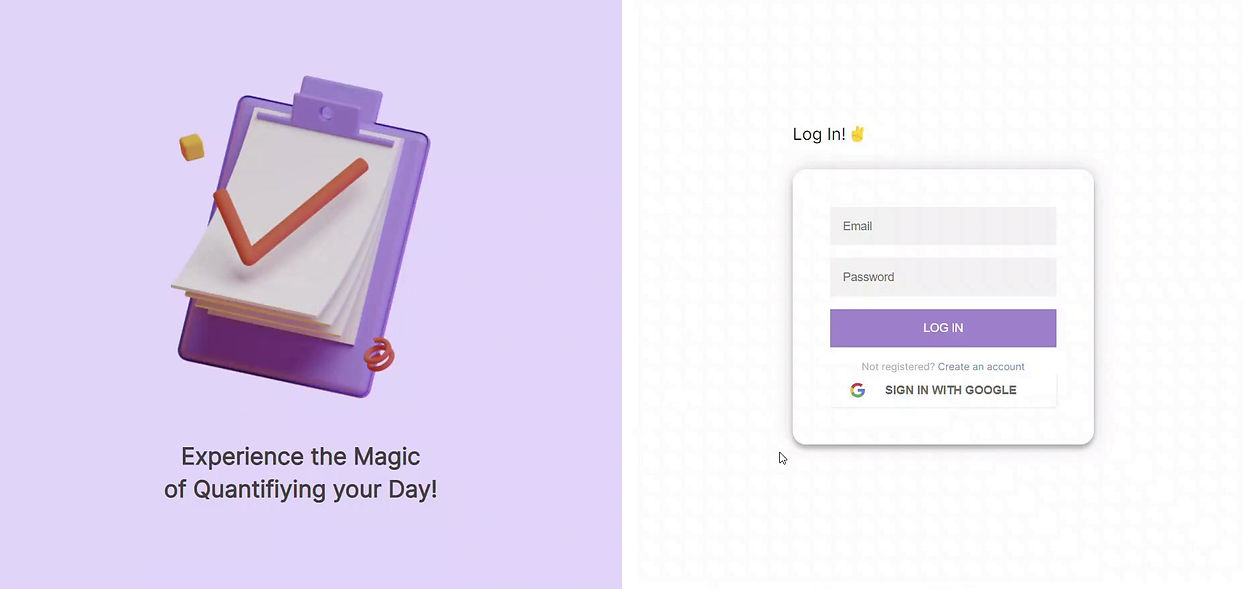
Key screens of the NorthStar that I was aiming for:
%20(3).png)
Default State of Todo Page
%20(4).png)
Mid-Use State of Todo Page
.png)
Mid-Use State of Insights Page
03
DEVELOPMENT
I developed only the todo page and the target was to store each of the tasks based on the date, so I could easily fetch them later to generate a heatmap of when I did and didn't do the task when I develop Insights page in the future
TOOLS USED
-
React for frontend
-
Firebase for backend
WHY THESE TOOLS
-
My primary motivation for choosing React is because there are a lot of repeating items in a todo list and for the scope of this project I wanted it to be a single page dashboard and not have multi-page functionality.
-
My primary motivation to choose firebase for backend is to have continuity across sessions and real time updation of multiple data elements in server which is a very crucial aspect in an application saying that it tracks and quantifies your day.
DISSECTION OF SCREEN INTO INDIVIDUAL FEATURES
%20(5).png)
-
Date Picker : To view the corresponding tasks of that specific date --> Could be achieved by keeping data as the starting node in database
-
Total Score of the day : This solves my problem of quantifying my productivity rather than judging visually --> Should keep track of score of each individual category (7) and the weightage of that category (9)
-
Estimated time to finish remaining tasks & Time left for the day : Could be achieved by asking user estimated time every time they add task, but realized while testing that its too time taking. So settled just with time left for the day
-
Four Categories by default : Philosophy was that users could add contextual tasks of the day in personal, things they wish to do daily for their physical & mental health in maintenance, things that are expected out of them by default in bare minimum which could be same for long durations like 4 months in case of me as I'm a student, things that help me in the long-term but not so important now in Exceed which usually might stay same for long time too
-
Striking off the finished items : Later realized that its better to have active and finished tasks filter too
-
Add New task & Scrollbar appearance after certain threshold : Later realized its better if the list could be extended infinite so that I could have visual view of things too along with the score
-
Category Score : Help me track category score over time & helps complementing visual judgement
-
Sync with calendar : Realized that users have to allocate start and end time for every task which might be tedious, so dropped it for now. Not in the immediate scope of project so will reconsider later
-
Weightage : Easy way to visually judge the weightage of each category to final score, clicking on it users could input the weightage they want for each category
-
Add Category : While adding category ask users for name, weightage and nature of repetition (daily, weekly, monthly, 3 months, 6 months, annually, till certain date etc.,

Kanban

VSC Environment
CHALLENGES FACED
I lost track of the amount of challenges I had with making the backend work. Primary challenge is the real time updation instead of session end updation based approach. Every item added by the user has to be stored in the database and then reflected from there to be displayed. That took a lot of time.
Faced major issues with hosting the application too as initially I had forgotten to have a .gitignore file and it started uploading all the node_modules and it started throwing multiple errors because of long names. Issue was gone when I added the .gitignore file.
Other issues that are coming into my mind are real-time score calculation (For which I wrote loops before but when it didn’t work, created a new place in database to store them outside the loop and fetch them instead), making the sign in with google page work by adding O auths both before and after hosting on github, changing the structure of database for it to be more date centric so that it's easy to work on insights in future etc.,
Webapp link: https://pvegired.github.io/life-in-numbers/#/
GitHub repository link: https://github.com/pvegired/life-in-numbers/tree/master